Home » Tree Diagram Probability
Category Archives: Tree Diagram Probability
Tree Diagram Probability problems
Tree Diagram Spinner example problem
A fair spinner showing numbers 1 through 3 of equal area is spun twice. Find the probabilities of the following events:
a) The sum of numbers landed on is odd
b) The sum of numbers landed on is even
c) The two numbers are different
d) Given even first number, the second number is even
e) Given odd first number, the second number is odd
f) The product of the two numbers landed on is less than 6
Solution to this Calculus Tree Diagram Probability practice problem is given in the video below!
Tree Diagram Conditional Probability example question #2
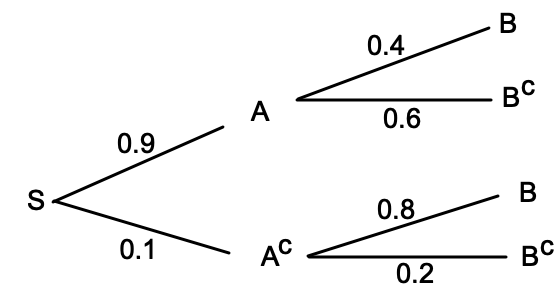
For the given Tree Diagram, calculate the P(A | Bc).
Solution to this Calculus Tree Diagram Probability practice problem is given in the video below!
Tree Diagram Marbles in a Jar probability example
Suppose we have 3 jars: A, B and C. Jar A contains 2 red marbles and 1 blue marble. Jar B contains 1 red marble and 2 blue marbles. Jar C contains 2 red marbles and 2 blue marbles. We select a jar at random. The probability we select A is  . The probability we select B is . The probability we select C is
  . From the selected jar, we choose 1 marble; all marbles in the jar have the same chance of being selected.
a) What is the probability the chosen marble is red?
b) Given that the chosen marble is red, what is the probability that the selected jar was A?
Solution to this Calculus Tree Diagram Probability practice problem is given in the video below!
Tree Diagram HARD Steroid Drug probability example problem
In recent years, the “Tour de France” cycling race has been plagued with accusations that cyclists have taken steroids to boost their performance. Testing for these steroids has been difficult. The level of steroids that naturally occur in the human body can vary between individuals and the levels can change throughout the day. Testing for the presence of steroids is expensive and time-consuming. Racers are randomly chosen for drug tests. Suppose that 2% of racers have taken an illegal steroid. Assume that if they took the drug, there is a 99% chance that the test will return a “positive” reading and the athlete will be disqualified.
a) Draw a Tree Diagram showing the probabilities for the sequence of events in which an athlete either takes or does not take a drug, and then is tested for the presence of the drug.
b) What is the probability that a randomly chosen cyclist will be steroid-free and will still test positive for steroids?
c) What is the probability that a randomly chosen cyclist will be disqualified due to a “positive” reading?
Solution to this Calculus Tree Diagram Probability practice problem is given in the video below!
Recent Comments